Home /
Expert Answers /
Electrical Engineering /
q1-the-table-below-gives-the-set-of-10-measurements-that-were-recorded-in-the-laboratory-calculat-pa412
(Solved): Q1: The table below gives the set of 10 measurements that were recorded in the laboratory. Calculat ...
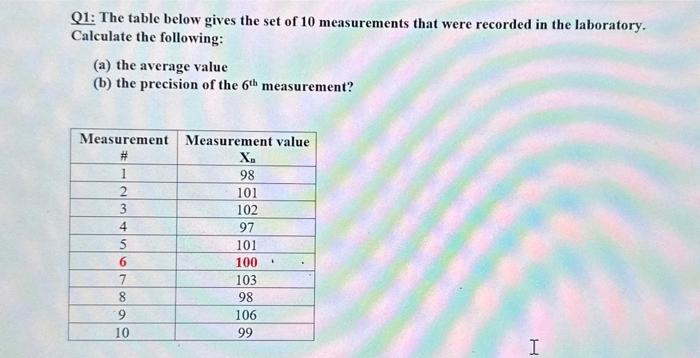
Q1: The table below gives the set of 10 measurements that were recorded in the laboratory. Calculate the following: (a) the average value (b) the precision of the \( 6^{\text {th }} \) measurement?
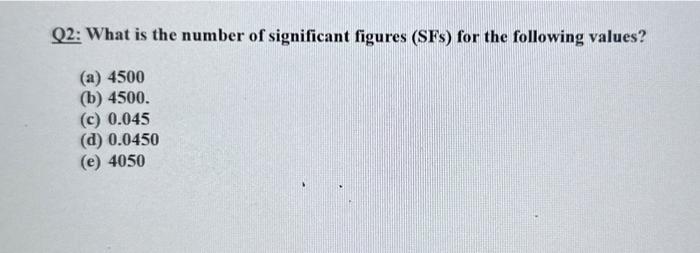
Q2: What is the number of significant figures (SFs) for the following values? (a) 4500 (b) 4500 . (c) \( 0.045 \) (d) \( 0.0450 \) (e) 4050
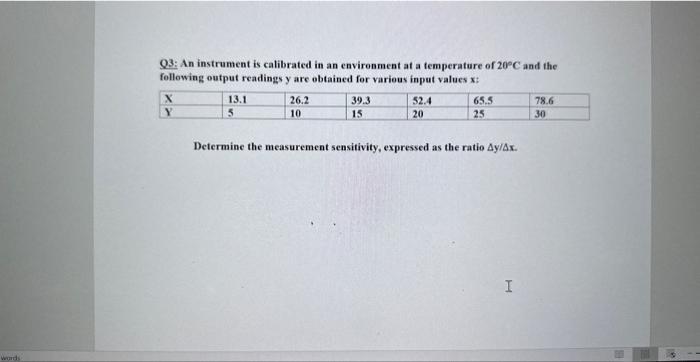
Q3: An instrument is calibrated in an envirenment at a temperature of \( 20^{\circ} \mathrm{C} \) and the following output readings \( y \) are obtained for varieus input values \( x \) : Determine the measurement sensitivity, expressed as the ratio \( \Delta y / \Delta x \).