Home /
Expert Answers /
Economics /
the-following-graph-shows-crest-39-s-demand-curve-marginal-revenue-mr-curve-average-total-cost-a-pa446
(Solved): The following graph shows Crest's demand curve, marginal-revenue (MR) curve, average-total-cost (A ...
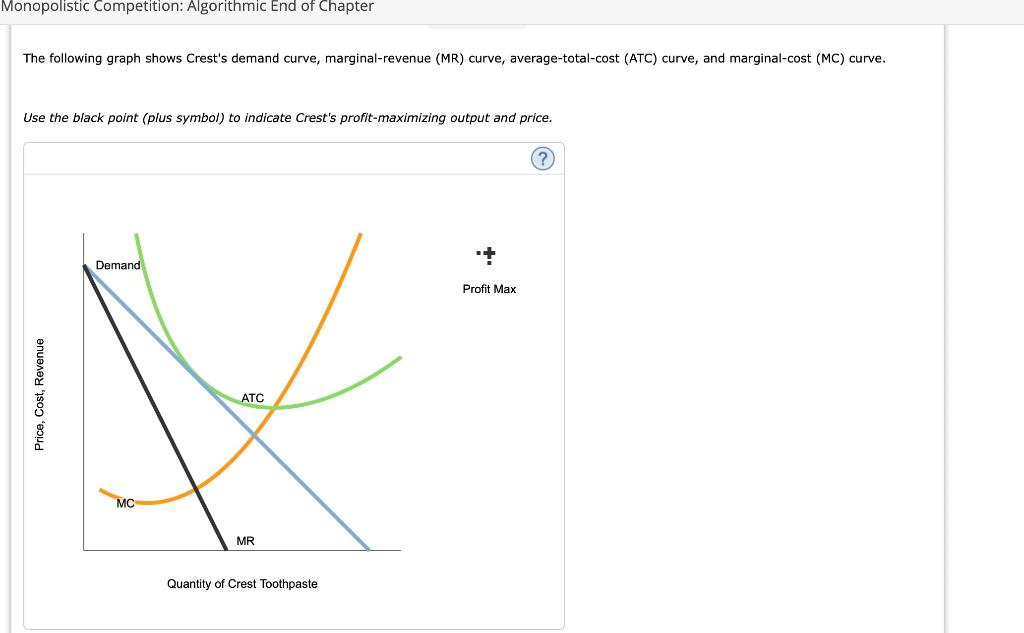
The following graph shows Crest's demand curve, marginal-revenue (MR) curve, average-total-cost (ATC) curve, and marginal-cost (MC) curve. Use the black point (plus symbol) to indicate Crest's profit-maximizing output and price.
True or False: Crest's profit is zero. True False
Expert Answer
A firm will maximize its profit where the MR curve intersects the MC curve. So the firm will charge. In the above graph, if we draw a ve